Tikz examples

Here are some figures from the papers I recently published, togheter with their Tikz code. These are not optimally coded and have some vestigial indenting. The figures are mostly related with surfaces of finite genus, with (possibly empty) boundary components and marked points.

Figures for "A qualitative description of the horoboundary of the Teichmüller metric"

 
  \begin{figure}
    \begin{tikzpicture}
      \pgfmathsetseed{1}
      \pgfmathsetmacro\spin{5*360};
      \draw  (0,0) ellipse (5 and 5);
      \foreach \r in {1,...,\spin}{
        \pgfmathsetmacro\disp{rnd};
        \pgfmathsetmacro\radius{ln(rnd)/4+5};
        \draw [smooth] (\r+\disp:5) to (\r+\disp: \radius);
      }
      \node [circle,fill,inner sep=0.5pt,label=below:$b$] (b) at (0,0) {};
    \end{tikzpicture}
    \caption{Sketch of the shape of the horoboundary of the Teichmüller metric for surfaces without boundary.}
    \label{fi:cartoonfinal}
  \end{figure}


  \begin{figure}
    \begin{tikzpicture}[scale=3]

      \node at (1/3,1/9) [circle,fill,inner sep=1pt,label=below:$b$](b){};
      \node at (0.5,0.8) [circle,fill,inner sep=1pt,label=above:$\gamma'(t)$](away){};
      \node at (3,1) [circle,fill,inner sep=1pt,label=right:$\gamma(t_n)$](upper){};
      \node at (-1/3,-1/9) [circle,fill,inner sep=1pt,label=left:$\gamma(-s)$](back){};
      \draw (b) -- node[label=right:$t$]{} (away);
      \draw (b) -- node[label=below:$t_n$]{} (upper);
      \draw (upper) --  node[label=above:$ < t_n-t+\varepsilon_n$]{} (away);
      \draw (back) -- node[label=below:$s$]{} (b);
      \draw (back) --  node[label=left:$ < t+s-\delta$]{} (away);

    \end{tikzpicture}
    \caption{The triangles involved in the proof of Proposition \ref{pr:bussmapinjective}.}
    \label{fi:badtriangles}
  \end{figure}


  \begin{figure}
    \begin{tikzpicture}[scale=3]
      \node [circle,fill,inner sep=1pt,label=below:$b$] (b) at (0,0) {};
      \node [circle,fill,inner sep=1pt,label=below:$\gamma_n(t_n)$] (c) at (2.5,0.6) {};
      \node [circle,fill,inner sep=1pt,label=above:$\gamma(t_n)$] (d) at (2,1.5) {};
      \node [circle,fill,inner sep=1pt,label=above:$\gamma(t)$] (e) at (1.4,0.8) {};
      \node [circle,fill,inner sep=1pt,label=below:$\gamma_n(t)$] (f) at (1.5,0.6) {};
      \draw plot[smooth, tension=.7] coordinates {(b) (f) (c)};
      \draw plot[smooth, tension=.7] coordinates {(b) (e) (d)};
      \draw (e) --  node[fill=white,inner ysep=2pt]{$\varepsilon_n$} (f);
    \end{tikzpicture}
    \caption{
      In the proof of Lemma \ref{le:fixingvaluealongpath}, $\gamma_n$ converges to $\gamma$, so $\gamma_n(t)$ converges to $\gamma(t)$, and hence the distance between $\gamma_n(t_n)$ and $\gamma_n(t)$ gets arbitrarily close to the distance between $\gamma_n(t_n)$ and $\gamma(t)$.
    }
    \label{fi:squeezedtriangle}
  \end{figure}   

 
\begin{figure}
  \centering
  \begin{tikzpicture}
    \draw[smooth] (-3,0) to  [out=90, in = 180] (0,2.5) to [out=0,in=90] (3,0);
    
    \draw[smooth] (-2,0) to  [out=90,in=90] (-0.5,0);
    
    \draw[smooth] (0.5,0) to  [out=90,in=90] (2,0);
    
    \draw(-3,0) arc(180:0:0.5 and 0.25);
    \draw(-3,0) arc(180:360:0.5 and 0.25);
    
    \draw(-0.5,0) arc(180:0:0.5 and 0.25);
    \draw(-0.5,0) arc(180:360:0.5 and 0.25);
    
    \draw(2,0) arc(180:0:0.5 and 0.25);
    \draw(2,0) arc(180:360:0.5 and 0.25);
    
    \begin{scope}[xshift=-40,yshift=50]
      \draw[smooth] (0.4,0.1) .. controls (0.8,-0.25) and (1.2,-0.25) .. (1.6,0.1);
      \draw[smooth] (0.5,0) .. controls (0.8,0.2) and (1.2,0.2) .. (1.5,0);
      \draw  (1,0) ellipse (0.8 and 0.4);
    \end{scope}
    
    \draw[smooth] (0,0.25) to  [out=90, in = 90] (-2.5,0.25);
    
    \begin{scope}[xshift=40,yshift=35,rotate=270]
      \draw(0.5,0.5) .. controls (-0.2,0.1) .. (-0.5,-0.5); 
      \draw(-0.5,0.5) .. controls (-0.2,0.1) .. (0.5,-0.5); 
      \draw(0.5,0.4) .. controls (-0.1,0.1) .. (0.5,-0.4); 
      \draw(-0.4,0.5) .. controls (-0.2,0.2) .. (0.4,0.5); 
      \draw(-0.5,0.4) .. controls (-0.25,0.1) .. (-0.5,-0.4); 
      \draw(-0.4,-0.5) .. controls (-0.2,0.1) .. (0.4,-0.5); 
    \end{scope}
    
    \begin{scope}[xscale=1,yscale=-1,yshift=20]
      \draw[smooth] (-3,0) to  [out=90, in = 180] (0,2.5) to [out=0,in=90] (3,0);
      
      \draw[smooth] (-2,0) to  [out=90,in=90] (-0.5,0);
      
      \draw[smooth] (0.5,0) to  [out=90,in=90] (2,0);
      
      \draw[dashed](-3,0) arc(180:0:0.5 and 0.25);
      \draw(-3,0) arc(180:360:0.5 and 0.25);
      
      \draw[dashed](-0.5,0) arc(180:0:0.5 and 0.25);
      \draw(-0.5,0) arc(180:360:0.5 and 0.25);
      
      \draw[dashed](2,0) arc(180:0:0.5 and 0.25);
      \draw(2,0) arc(180:360:0.5 and 0.25);
      
      \begin{scope}[xshift=-40,yshift=50,yscale=-1]
        \draw[smooth] (0.4,0.1) .. controls (0.8,-0.25) and (1.2,-0.25) .. (1.6,0.1);
        \draw[smooth] (0.5,0) .. controls (0.8,0.2) and (1.2,0.2) .. (1.5,0);
        \draw  (1,0) ellipse (0.8 and 0.4);
      \end{scope}
      
      \draw[smooth] (0,-0.25) to (0,0.25) to  [out=90, in = 90] (-2.5,0.25) to (-2.5,-0.25);
      
      \begin{scope}[xshift=40,yshift=35,rotate=270]
        \draw(0.5,0.5) .. controls (-0.2,0.1) .. (-0.5,-0.5); 
        \draw(-0.5,0.5) .. controls (-0.2,0.1) .. (0.5,-0.5); 
        \draw(0.5,0.4) .. controls (-0.1,0.1) .. (0.5,-0.4); 
        \draw(-0.4,0.5) .. controls (-0.2,0.2) .. (0.4,0.5); 
        \draw(-0.5,0.4) .. controls (-0.25,0.1) .. (-0.5,-0.4); 
        \draw(-0.4,-0.5) .. controls (-0.2,0.1) .. (0.4,-0.5); 
      \end{scope}
      
    \end{scope}
  \end{tikzpicture}
  \caption{Visual representation of the doubling trick.}
  \label{fi:doublingtrick}
\end{figure}


  \begin{figure}
     \begin{subfigure}[b]{0.45\textwidth}
       \centering
       \resizebox{\linewidth}{!}{
       \begin{tikzpicture}[scale=2]
         \node [label=right:$b$] at (-0.5,0) {};
         \draw  (0,0) ellipse (0.5 and 0.5);
        
         \node [label=left:$\beta$] at (-0.7,0) {};
         \draw  (0,0) ellipse (0.7 and 0.7);
          
         \node [label=above:$\gamma$] at (1,0) {};
         \draw (0.5,0) to [out=0, in =120] (1,0) to [out=-60,in=200] (1.5,0);    
       \end{tikzpicture}}  
       \caption{}
       \label{fi:samplecurves1}
      \end{subfigure}
     \begin{subfigure}[b]{0.45\textwidth}
      \centering
      \resizebox{\linewidth}{!}{
      \begin{tikzpicture}[scale=2]
        \node [label=above:$b$] at (0,-0.5) {};
        \draw  (0,0) ellipse (0.5 and 0.5);
          
        \node[circle,fill,inner sep=1pt] at (120:0.5) {};
        \node[circle,fill,inner sep=1pt] at (80:0.5) {};
        \node[circle,fill,inner sep=1pt] at (230:0.5) {};
          
        \node [label=left: ] at (-0.7,0) {};
          
        \node [label=above:$\beta$] at (50:0.7) {};
        \draw (90:0.5) to (90:0.7);
        \draw (220:0.5) to (220:0.7);
        \draw (90:0.7) arc (90:-140:0.7) ;
        
        \node [label=above:$\gamma$] at (1,0) {};
        \draw (0.5,0) to [out=0, in =120] (1,0) to [out=-60,in=200] (1.5,0);
      \end{tikzpicture}}  
      \caption{}
      \label{fi:samplecurves2}
    \end{subfigure}
    \caption{Sample curves used in the proof of \cref{le:notsplittingboundary4}}
    \label{fi:samplecurvesboth}
  \end{figure}


    \begin{figure}
      \begin{subfigure}[b]{0.30\textwidth}
        \centering
        \resizebox{\linewidth}{!}{
          \begin{tikzpicture}[scale=2]
            \node [label=above:$b_1$] at (0,-0.5) {};
            \draw  (0,0) ellipse (0.5 and 0.5);
            
            \node[circle,fill,inner sep=1pt] at (120:0.5) {};
            
            \node [label=above:$A$] at (1,0.1) {};
            \draw (-10:0.6) arc (-10:-350:0.6) ;
            \draw (10:0.6) to [out=0, in =120] (1,0.1) to [out=-60,in=180] ($(170:0.6)+(2,0)$);
            \draw ($(170:0.6)+(2,0)$) arc (170:190-360:0.6) ;
            \draw (-10:0.6) to [out=0, in =120] (1,-0.1) to [out=-60,in=180] ($(190:0.6)+(2,0)$);
            
            \draw (0.5,0) to [out=0, in =120] (1,0) to [out=-60,in=180] (1.5,0);    
            
            \node [label=above:$b_2$] at (2,-0.5) {};
            \draw  (2,0) ellipse (0.5 and 0.5);
        \end{tikzpicture}}  
        \caption{}
        \label{fi:boundarycurves1}
      \end{subfigure}
      \begin{subfigure}[b]{0.30\textwidth}
        \centering
        \resizebox{\linewidth}{!}{
        \begin{tikzpicture}[scale=2]
          \node [label=above:$b_1$] at (0,-0.5) {};
          \draw  (0,0) ellipse (0.5 and 0.5);
          
          \node[circle,fill,inner sep=1pt] at (120:0.5) {};
          \node[circle,fill,inner sep=1pt] at (80:0.5) {};
          \node[circle,fill,inner sep=1pt] at (230:0.5) {};
          
          \node [label=above:$A$] at (1,0.1) {};
          \draw (90:0.5) to (90:0.6);
          \draw (220:0.5) to (220:0.6);
          \draw (90:0.6) arc (90:10:0.6) ;
          \draw (-10:0.6) arc (-10:-140:0.6) ;
          \draw (10:0.6) to [out=0, in =120] (1,0.1) to [out=-60,in=180] ($(170:0.6)+(2,0)$);
          \draw ($(170:0.6)+(2,0)$) arc (170:190-360:0.6) ;
          \draw (-10:0.6) to [out=0, in =120] (1,-0.1) to [out=-60,in=180] ($(190:0.6)+(2,0)$);
          
          \draw (0.5,0) to [out=0, in =120] (1,0) to [out=-60,in=180] (1.5,0);    
          
          \node [label=above:$b_2$] at (2,-0.5) {};
          \draw  (2,0) ellipse (0.5 and 0.5);
        \end{tikzpicture}}  
        \caption{}
        \label{fi:boundarycurves2}
      \end{subfigure}
      \begin{subfigure}[b]{0.30\textwidth}
        \centering
        \resizebox{\linewidth}{!}{
        \begin{tikzpicture}[scale=2]
          \node [label=above:$b_1$] at (0,-0.5) {};
          \draw  (0,0) ellipse (0.5 and 0.5);
          
          \node[circle,fill,inner sep=1pt] at (120:0.5) {};
          \node[circle,fill,inner sep=1pt] at (80:0.5) {};
          \node[circle,fill,inner sep=1pt] at (230:0.5) {};
          
          \node[circle,fill,inner sep=1pt] at ($(150:0.5)+(2,0)$) {};
          \node[circle,fill,inner sep=1pt] at ($(-20:0.5)+(2,0)$) {};
          
          
          \node [label=above:$A_1$] at (1,0.1) {};
          \draw (90:0.5) to (90:0.6);
          \draw (90:0.6) arc (90:10:0.6) ;
          \draw (10:0.6) to [out=0, in =120] (1,0.1) to [out=-60,in=180] ($(170:0.6)+(2,0)$);
          \draw ($(170:0.6)+(2,0)$) arc (170:140:0.6) ;
          \draw ($(140:0.5)+(2,0)$) to ($(140:0.6)+(2,0)$);
          
          \node [label=below:$A_2$] at (1,-0.1) {};
          \draw ($(190:0.6)+(2,0)$) arc (190:350:0.6) ;
          \draw (-10:0.6) to [out=0, in =120] (1,-0.1) to [out=-60,in=180] ($(190:0.6)+(2,0)$);
          \draw ($(350:0.5)+(2,0)$) to ($(350:0.6)+(2,0)$);
          \draw (220:0.5) to (220:0.6);
          \draw (-10:0.6) arc (-10:-140:0.6) ;
          
          \draw (0.5,0) to [out=0, in =120] (1,0) to [out=-60,in=180] (1.5,0);    
          
          \node [label=above:$b_2$] at (2,-0.5) {};
          \draw  (2,0) ellipse (0.5 and 0.5);
        \end{tikzpicture}}  
        \caption{}
        \label{fi:boundarycurves3}
      \end{subfigure}
      \caption{Construction of the curves $A_1$ and $A_2$ whenever $\gamma$ has endpoints in different boundary components in the proof of \cref{le:notsplittingboundary4}}
    \end{figure}


    \begin{figure}
      \begin{subfigure}[b]{0.30\textwidth}
        \centering
        \resizebox{\linewidth}{!}{
        \begin{tikzpicture}[scale=2]
          \node [label=above:$b$] at (0,-0.5) {};
          \draw  (0,0) ellipse (0.5 and 0.5);
          
          \draw (20:0.5) to [out=20, in =0] (0.5,1) to [out= 180, in = 10] (-0.5,1.5) to [out=190,in=160] (160:0.5);
          
          \node [label=above:$A_1$] at (0,0.5) {};
          \draw (30:0.6) to [out=30, in =0] (0.5,0.9) to [out= 180, in = 10] (-0.45,1.4) to [out=190,in=150] (150:0.6);
          
          \node [label=above:$A_2$] at (0,1.4) {};
          \draw (10:0.6) to [out=10, in =0] (0.5,1.1) to [out= 180, in = 10] (-0.5,1.6) to [out=190,in=170] (170:0.6);
          
          \draw (10:0.6) arc (10:-190:0.6) ;
          
          \draw (30:0.6) arc (30:150:0.6) ;
          
          \node[circle,fill,inner sep=1pt] at (120:0.5) {};
        \end{tikzpicture}}  
        \caption{}
        \label{fi:boundarycurves4}
      \end{subfigure}
      \begin{subfigure}[b]{0.30\textwidth}
        \centering
        \resizebox{\linewidth}{!}{
        \begin{tikzpicture}[scale=2]
          \node [label=right:$b$] at (-0.5,0) {};
          \draw  (0,0) ellipse (0.5 and 0.5);
          
          \draw (20:0.5) to [out=20, in =0] (0.5,1) to [out= 180, in = 10] (-0.5,1.5) to [out=190,in=160] (160:0.5);
          
          \node [label=above:$A_1$] at (0,0.5) {};
          \draw (30:0.6) to [out=30, in =0] (0.5,0.9) to [out= 180, in = 10] (-0.45,1.4) to [out=190,in=150] (150:0.6);
          \draw (30:0.6) arc (30:150:0.6) ;
          
          \node [label=above:$A_2$] at (0,1.4) {};
          \draw (10:0.6) to [out=10, in =0] (0.5,1.1) to [out= 180, in = 10] (-0.5,1.6) to [out=190,in=170] (170:0.6);
          \draw (10:0.6) arc (10:-70:0.6) ;
          \draw (-70:0.6) to (-70:0.5) ;
          \draw (170:0.6) arc (170:230:0.6) ;
          \draw (230:0.6) to (230:0.5) ;
          
          \node[circle,fill,inner sep=1pt] at (220:0.5) {};
          \node[circle,fill,inner sep=1pt] at (300:0.5) {};
        \end{tikzpicture}}  
        \caption{}
        \label{fi:boundarycurves5}
      \end{subfigure}
      \begin{subfigure}[b]{0.30\textwidth}
        \centering
        \resizebox{\linewidth}{!}{
        \begin{tikzpicture}[scale=2]
          \node [label=right:$b_1$] at (-0.5,0) {};
          \node [label=left:$b_2$] at (0.5,0) {};
          \draw  (0,0) ellipse (0.5 and 0.5);
          
          \draw (20:0.5) to [out=20, in =0] (0.5,1) to [out= 180, in = 10] (-0.5,1.5) to [out=190,in=160] (160:0.5);
          
          \node [label=above:$A_1$] at (-0.5,0.5) {};
          \draw (30:0.6) to [out=30, in =0] (0.5,0.9) to [out= 180, in = 10] (-0.45,1.4) to [out=190,in=150] (150:0.6);
          \draw (30:0.6) arc (30:40:0.6) ;
          \draw (40:0.6) to (40:0.5) ;
          \draw (120:0.6) arc (120:150:0.6) ;
          \draw (120:0.6) to (120:0.5) ;
          
          \node [label=above:$A_2$] at (0,1.4) {};
          \draw (10:0.6) to [out=10, in =0] (0.5,1.1) to [out= 180, in = 10] (-0.5,1.6) to [out=190,in=170] (170:0.6);
          \draw (10:0.6) arc (10:-70:0.6) ;
          \draw (-70:0.6) to (-70:0.5) ;
          \draw (170:0.6) arc (170:230:0.6) ;
          \draw (230:0.6) to (230:0.5) ;
          
          \node[circle,fill,inner sep=1pt] at (220:0.5) {};
          \node[circle,fill,inner sep=1pt] at (300:0.5) {};
          
          \node[circle,fill,inner sep=1pt] at (30:0.5) {};
          \node[circle,fill,inner sep=1pt] at (60:0.5) {};  
          \node[circle,fill,inner sep=1pt] at (95:0.5) {};
          \node[circle,fill,inner sep=1pt] at (130:0.5) {};
        \end{tikzpicture}}  
        \caption{}
        \label{fi:boundarycurves6}
      \end{subfigure}
      \caption{Construction of the curves $A_1$ and $A_2$ whenever $\gamma$ has endpoints in the same boundary component in the proof of \cref{le:notsplittingboundary4}}
    \end{figure}


    \begin{figure}
      \begin{tikzpicture}
        \draw[rotate=150]  (0:4) ellipse (0.25 and 1);
        \draw[rotate=30]    (0:4) ellipse (0.25 and 1);
        \draw[rotate=270]  (0:4) ellipse (0.25 and 1);
              
        \draw[smooth] [rotate=30] (4,1) to  [out=170,in=-30] (60:2.3) to [out=150,in=-50] ($ (120:4)+({120-90}:1)$);
        \draw[smooth] [rotate=150] (4,1) to  [out=170,in=-30] (60:2.3) to [out=150,in=-50] ($ (120:4)+({120-90}:1)$);
        \draw[smooth] [rotate=270] (4,1) to  [out=170,in=-30] (60:2.3) to [out=150,in=-50] ($ (120:4)+({120-90}:1)$);
        
        \node[label=left:$F$] at (-0.5,2){};
  
        \draw[smooth] [rotate=30] (3.8,0.5) to  [out=170,in=-30] (60:1.7) to [out=150,in=-50] ($ (120:3.8)+({120-90}:0.5)$);
        
        
        \node[label=above:$B_3$] at (0:3.5) {};
        \draw[dashed] [rotate=30] (3.3,1.14) arc(90:-90:0.25 and 1.14);
        \draw[rotate=30] (3.3,1.14) arc(90:270:0.25 and 1.14);
        
        \node[label=above:$B_2$] at (180:3.5) {};
        \draw[dashed] [rotate=150] (3.3,1.14) arc(90:-90:0.25 and 1.14);
        \draw[rotate=150] (3.3,1.14) arc(90:270:0.25 and 1.14);
        
        \node[label=left:$B_1$] at (-1,-4){};
        
        \node[label=above:$C$] at (270:2.3) {};
        \draw [rotate=90] (0:2.3) arc(0:88:6.3 and 0.5);
        \draw[dashed] [rotate=90] (0:2.3) arc(0:-92:6.3 and 0.5);
        
        
        \node[label=left:$E$] at (210:2.3) {};
        \draw[dashed]  [rotate=210] (0:2.3) arc(0:92.3:6.3 and 0.25);
        \draw [rotate=210] (0:2.3) arc(0:-87.7:6.3 and 0.25);
        
        \node[label=right:$D$] at (330:2.3) {};
        \draw[dashed] [rotate=330] (0:2.3) arc(0:92.3:6.3 and 0.25);
        \draw [rotate=330] (0:2.3) arc(0:-87.7:6.3 and 0.25);
      \end{tikzpicture}
      \caption{Curve labeling for the proof of Lemma \ref{le:notsplittingboundary5}}
      \label{fi:curvelabeling}
    \end{figure}


  \begin{figure}
    \begin{tikzpicture}
      \draw[smooth] (2.5,-0.85) to[out=180,in=30] (2,-1) to[out=210,in=-30] (0,-1) to[out=150,in=-150] (0,1) to[out=30,in=150] (2,1) to[out=-30,in=180] (2.5,0.85);
      \draw[smooth] (0.4,0.1) .. controls (0.8,-0.25) and (1.2,-0.25) .. (1.6,0.1);
      \draw[smooth] (0.5,0) .. controls (0.8,0.2) and (1.2,0.2) .. (1.5,0);
      \draw (2.5,-0.85) arc(270:90:0.3 and 0.85);
      \draw (2.5,-0.85) arc(270:450:0.3 and 0.85);
      \draw[smooth] (2.26,-0.5) to[out=180,in=30] (2,-0.6) to[out=210,in=270] (0,0) to[out=90,in=150] (2,0.6) to[out=-30,in=180] (2.26,0.5);
      
      \draw (3.5,-0.85) arc(270:90:0.3 and 0.85);
      \draw[dashed] (3.5,-0.85) arc(270:450:0.3 and 0.85);
      \draw (6,-0.85) arc(270:90:0.3 and 0.85);
      \draw (6,-0.85) arc(270:450:0.3 and 0.85);
      \draw (3.5,-0.85) to (6,-0.85);
      \draw (3.25,-0.5) to (5.75,-0.5);
      \draw (3.25,0.5) to (5.75,0.5);
      \draw[smooth] (3.5,0.85) to[out=0,in=260] (4.75,1.5) to [out=280,in=180] (6,0.85) ;
      \node at (4.75,1.5) [circle,fill,inner sep=0.7pt]{};
      
      \draw (7,-0.85) arc(270:90:0.3 and 0.85);
      \draw[dashed] (7,-0.85) arc(270:450:0.3 and 0.85);
      \draw (9.5,-0.85) arc(270:90:0.3 and 0.85);
      \draw (9.5,-0.85) arc(270:450:0.3 and 0.85);
      \draw (7,-0.85) to (9.5,-0.85);
      \draw[smooth] (7,0.85) to[out=0,in=260] (7.75,1.5)  ;
      \draw[smooth] (8.75,1.5) to[out=280,in=180] (9.5,0.85)  ;
      \draw (7.75,1.5) arc(180:0:0.5 and 0.15);
      \draw (7.75,1.5) arc(-180:0:0.5 and 0.15);
      \draw (6.75,-0.5) to (9.25,-0.5);
      \draw[smooth] (6.75,0.5) to[out=0, in = 270] (8,1.37);
      \draw[smooth] (9.25,0.5) to[out=180, in = 270] (8.5,1.37);
      
      \draw (10.5,-0.85) arc(270:90:0.3 and 0.85);
      \draw[dashed] (10.5,-0.85) arc(270:450:0.3 and 0.85);
      \draw[smooth](10.5,0.85) to [out=0, in = 220] (12.5,1.5) to [out=240, in = 120] (12.5,-1.5) to [out=140, in = 0] (10.5,-0.85);  
      \draw[smooth](10.25,-0.5)  to [out=0, in = 230] (12.06,0) ;  
      \draw[smooth,dashed](12.06,0)  to [out=100, in = -20] (11.5,0.95) ;  
      \draw[smooth](11.5,0.95) to [out=200, in = 0] (10.25,0.5) ;  
      \node at (12.5,1.5) [circle,fill,inner sep=0.7pt]{};
      \node at (12.5,-1.5)  [circle,fill,inner sep=0.7pt]{};
    \end{tikzpicture}
    \caption{Laying out of curve segments for the proof of Lemma \ref{le:interesctingcurves}}
    \label{fi:pathslaying}
  \end{figure}


\begin{figure}
  \begin{tikzpicture}
    \draw[smooth] (5.5,-0.85) to[out=180,in=30] (5,-1) to[out=210,in=-30] (3,-1) to[out=150,in=30] (2,-1) to[out=210,in=-30] (0,-1) to[out=150,in=-150] (0,1) to[out=30,in=150] (2,1) to[out=-30,in=210] (3,1) to[out=30,in=150] (5,1) to[out=-30,in=180] (5.5,0.85);
    \draw[smooth] (0.4,0.1) .. controls (0.8,-0.25) and (1.2,-0.25) .. (1.6,0.1);
    \draw[smooth] (0.5,0) .. controls (0.8,0.2) and (1.2,0.2) .. (1.5,0);
    \draw[smooth] (3.4,0.1) .. controls (3.8,-0.25) and (4.2,-0.25) .. (4.6,0.1);
    \draw[smooth] (3.5,0) .. controls (3.8,0.2) and (4.2,0.2) .. (4.5,0);
    \node at (6.5,0) {$. \; \; . \; \; .$};
    \draw[smooth] (7.5,0.85) to[out=0,in=210] (8,1) to[out=30,in=150] (10,1) to[out=-30,in=210] (11,1) to[out=30,in=150] (13,1) to[out=-30,in=30] (13,-1) to[out=210,in=-30] (11,-1) to[out=150,in=30] (10,-1) to[out=210,in=-30] (8,-1) to[out=150,in=0] (7.5,-0.85);
    \draw[smooth] (8.4,0.1) .. controls (8.8,-0.25) and (9.2,-0.25) .. (9.6,0.1);
    \draw[smooth] (8.5,0) .. controls (8.8,0.2) and (9.2,0.2) .. (9.5,0);
    \draw[smooth] (11.4,0.1) .. controls (11.8,-0.25) and (12.2,-0.25) .. (12.6,0.1);
    \draw[smooth] (11.5,0) .. controls (11.8,0.2) and (12.2,0.2) .. (12.5,0);
    
    \draw (5.5,-0.85) arc(270:90:0.3 and 0.85);
    \draw (5.5,-0.85) arc(270:450:0.3 and 0.85);
    \draw (7.5,-0.85) arc(270:90:0.3 and 0.85);
    \draw[dashed] (7.5,-0.85) arc(270:450:0.3 and 0.85);
    
    
    \node [label=center:$G_3$] at (2.5,0) {};
    \draw (1.5,0) arc(180:0:1 and 0.2);
    \draw[dashed] (1.5,0) arc(180:0:1 and -0.2);
    
    \node [label=above:$G_1$] at (1,1.1) {};
    \draw (1.0,0.15) arc(270:90:0.3 and 1.14/2);
    \draw[dashed] (1.0,0.15) arc(270:450:0.3 and 1.14/2);
    
    \node [label=above:$G_2$] at (4,1.1) {};
    \draw (4.0,0.15) arc(270:90:0.3 and 1.14/2);
    \draw[dashed] (4.0,0.15) arc(270:450:0.3 and 1.14/2);
    
    \node [label=center:$G_{3C}$] at (10.5,0) {};
    \draw (9.5,0) arc(180:0:1 and 0.2);
    \draw[dashed] (9.5,0) arc(180:0:1 and -0.2);
    
    \node [label=above:$G_{3C-2}$] at (9,1.1) {};
    \draw (9.0,0.15) arc(270:90:0.3 and 1.14/2);
    \draw[dashed] (9.0,0.15) arc(270:450:0.3 and 1.14/2);
    
    \node [label=above:$G_{3C-1}$] at (12,1.1) {};
    \draw (12.0,0.15) arc(270:90:0.3 and 1.14/2);
    \draw[dashed] (12.0,0.15) arc(270:450:0.3 and 1.14/2);
    
    \node [label=center:$V_2$] at (1,-0.7) {};
    \draw  (1,0) ellipse (0.8 and 0.4);
    
    \node [label=center:$V_1$] at (4,-0.7) {};
    \draw  (4,0) ellipse (0.8 and 0.4);
    
    \node [label=left:$V_{3}$] at (0.2,0) {};
    \draw[smooth] (5,0) to[out=270,in=-30] (3,-0.8) to[out=150,in=30] (2,-0.8) to[out=210,in=270] (0,0)  to[out=90,in=150] (2,0.8) to[out=-30,in=210] (3,0.8) to[out=30,in=90] (5,0) ;
    
    \node [label=center:$V_{3C-1}$] at (9,-0.7) {};
    \draw  (9,0) ellipse (0.8 and 0.4);
    
    \node [label=center:$V_{3C-2}$] at (12,-0.7) {};
    \draw  (12,0) ellipse (0.8 and 0.4);
    
    \node [label=right:$V_{3C}$] at (12.8,0) {};
    \draw[smooth] (13,0) to[out=270,in=-30] (11,-0.8) to[out=150,in=30] (10,-0.8) to[out=210,in=270] (8,0)  to[out=90,in=150] (10,0.8) to[out=-30,in=210] (11,0.8) to[out=30,in=90] (13,0) ;
  \end{tikzpicture}
  \caption{Labeling of the curves when the surface has no boundaries nor marked points. If $g$ is odd then there is an unused handle.}
  \label{fi:v}
\end{figure}


  \begin{figure}
    \begin{tikzpicture}
      \draw[smooth] (5.5,-0.85) to[out=180,in=30] (5,-1) to[out=210,in=-30] (3,-1) to[out=150,in=30] (2,-1) to[out=210,in=-30] (0,-1)  to[out=150,in=0] (-0.5,-0.85);
      \draw[smooth](-0.5,0.85) to[out=0,in=210] (0,1) to[out=30,in=150] (2,1) to[out=-30,in=210] (3,1) to[out=30,in=150] (5,1) to[out=-30,in=180] (5.5,0.85);
      \draw (-0.5,-0.85) arc(270:90:0.3 and 0.85);
      \draw[dashed] (-0.5,-0.85) arc(270:450:0.3 and 0.85);
      \node[circle,fill,inner sep=1pt] at (3.7,0) {};
      \draw (5.5,-0.85) arc(270:90:0.3 and 0.85);
      \draw (5.5,-0.85) arc(270:450:0.3 and 0.85);
      
      \draw  (4.6,0) ellipse (0.2 and 0.2);
      
      \node [label=center:$G_{3k+3}$] at (2.5,0) {};
      \draw[smooth](1.4,0.2) to[out=20,in=90] (4,0)to[out=270, in=-20 ](1.4,-0.2) ; 
      
      \node [label=above:$G_{3k+2}$] at (4.5,1.1) {};
      \draw[dashed] (4.5,-1.21) arc(270:450:0.3 and 1.21);
      \draw (4.5,-1.21) arc(270:90:0.3 and 1.21);
      
      \node [label=above:$G_{3k+1}$] at (1.25,1.1) {};
      \draw (1.25,-1.27) arc(270:90:0.3 and 1.27);
      \draw  [fill=white](1,0) ellipse (0.45 and 0.45);
      \draw [dashed] (1.25,-1.27) arc(270:450:0.3 and 1.27);
      \node[circle,fill,inner sep=1pt] at (0.55,0) {};
    \end{tikzpicture}
    \begin{tikzpicture}
      \draw[smooth] (5.5,-0.85) to[out=180,in=30] (5,-1) to[out=210,in=-30] (3,-1) to[out=150,in=30] (2,-1) to[out=210,in=-30] (0,-1)  to[out=150,in=0] (-0.5,-0.85);
      \draw[smooth](-0.5,0.85) to[out=0,in=210] (0,1) to[out=30,in=150] (2,1) to[out=-30,in=210] (3,1) to[out=30,in=150] (5,1) to[out=-30,in=180] (5.5,0.85);
      \draw (-0.5,-0.85) arc(270:90:0.3 and 0.85);
      \draw[dashed] (-0.5,-0.85) arc(270:450:0.3 and 0.85);
          
      \draw (5.5,-0.85) arc(270:90:0.3 and 0.85);
      \draw (5.5,-0.85) arc(270:450:0.3 and 0.85);
          
      \node [label=above:$G_{3k+1}$] at (1,1.1) {};
      \draw (1.0,0.15) arc(270:90:0.3 and 1.14/2);
      \draw[dashed] (1.0,0.15) arc(270:450:0.3 and 1.14/2);
      
      \draw[smooth] (0.4,0.1) .. controls (0.8,-0.25) and (1.2,-0.25) .. (1.6,0.1);
      \draw[smooth] (0.5,0) .. controls (0.8,0.2) and (1.2,0.2) .. (1.5,0);
      
      \node [label=center:$G_{3k+3}$] at (2.5,0) {};
      \draw[smooth](4,0) to[out=200,in=-20] (1.3,-0.1) ; 
      \draw[smooth,dashed](1.3,-0.1) to [out= 230, in = 0](-0,-1) ;
      \draw[smooth](4,-0.3) to[out=200,in=-30] (0.7,-0.1) ; 
      \draw[smooth,dashed](0.7,-0.1) to [out= 230, in = -30](0.2,-0.2) to [out= 150,in = 0](-0,1) ;
      \draw (0,1) arc(120:240:0.3 and 1.15);
      
      \node [label=above:$G_{3k+2}$] at (4.5,1.1) {};
      \draw[dashed] (4.5,-1.21) arc(270:450:0.3 and 1.21);
      \draw (4.5,-1.21) arc(270:90:0.3 and 1.21);
      
      \draw  [fill=white](3.7+0.45,0) ellipse (0.45 and 0.45);
      \node[circle,fill,inner sep=1pt] at (3.7+0.9,0) {};
    \end{tikzpicture}
    \caption{Each pair of marked points and boundary components without marked points can replace a genus, as well as each boundary with marked points.}
    \label{fi:replacement}
  \end{figure}


  \begin{figure}
    \begin{tikzpicture}
      \draw (1,2) -- (1,-2) -- (-1,-2) -- (-1,2) --(1,2);
      \node [circle,fill,inner sep=1pt] at (-1,0) {};
      \node [circle,fill,inner sep=1pt] at (1,2) {};
      \node [circle,fill,inner sep=1pt] at (1,-2) {};
      \node [circle,fill,inner sep=1pt] at (-1,-2) {};
      \node [circle,fill,inner sep=1pt] at (-1,2) {};
      
      \draw[dashed] (-1,1) arc(180:0:1 and 0.5/2);
      \draw (-1,1) arc(180:369:1 and 0.5/2);
      \node [label=center:$\alpha$] at (0,0.5) {};
      
      \draw[dashed] (-1,-1) arc(180:0:1 and 0.5/2);
      \draw (-1,-1) arc(180:369:1 and 0.5/2);
      \node [label=center:$\beta$] at (0,-1.5) {};
    \end{tikzpicture}
    \label{fi:pillowcase}
    \caption{Sphere with five marked points, with curves $\alpha$ and $\beta$. We show that the extremal length is not $C^{2+\varepsilon}$ along the path $\alpha+t\beta$, $t\in[0,t_0]$.}
  \end{figure}


  \begin{figure}
    \begin{tikzpicture}
      \draw (-2,-3) -- (-2,0) -- (2,0) -- (2,-2) -- (0.5,-2) -- (0.5,-3) --(-2,-3);
      \node [label=below:$a$] at (-0.5,-3) {};
      \node [label=right:$l$] at (2,-1) {};
      \node [label=below:$b$] at (1.25,-2) {};
      \node [label=left:$1$] at (-2,-1.5) {};
      
      \draw[dashed] (-1,0) arc(90:270:0.5 and 1.5);
      \draw (-1,0) arc(90:-90:0.5 and 1.5);
      \node [label=center:$\alpha$] at (-0.25,-1.5) {};
      
      \draw[dashed] (1,0) arc(90:270:0.25 and 1);
      \draw (1,0) arc(90:-90:0.25 and 1);
      \node [label=center:$\beta$] at (1.5,-1) {};
      
      \node [circle,fill,inner sep=1pt] at (-2,-3) {};      
      \node [circle,fill,inner sep=1pt] at (-2,0) {};     
      \node [circle,fill,inner sep=1pt] at (2,0) {};  
      \node [circle,fill,inner sep=1pt] at (2,-2) {};     
      \node [circle,fill,inner sep=1pt] at (0.5,-3) {};     
    \end{tikzpicture}
    \caption{Doubling of the $L$-shaped polygon together with the curves $\alpha$ and $\beta$.}
    \label{fi:lshaped}
  \end{figure}


    \begin{figure}
      \begin{subfigure}[b]{0.30\textwidth}
        \centering
        \resizebox{\linewidth}{!}{
          \begin{tikzpicture}
            \draw[smooth]  (1.75,-1.5) to[out=120,in=-30] (0,-1) to[out=150,in=-150] (0,1)
            to[out=30,in=150] (2,1) to[out=-30,in=210] (3,1) to[out=30,in=150] (5,1)
            to (5,1) to[out=-30,in=30] (5,-1) to[out=210,in=70] (3.25,-1.5);
            \draw[smooth] (0.4,0.1) .. controls (0.8,-0.25) and (1.2,-0.25) .. (1.6,0.1);
            \draw[smooth] (0.5,0) .. controls (0.8,0.2) and (1.2,0.2) .. (1.5,0);
            \draw[smooth] (3.4,0.1) .. controls (3.8,-0.25) and (4.2,-0.25) .. (4.6,0.1);
            \draw[smooth] (3.5,0) .. controls (3.8,0.2) and (4.2,0.2) .. (4.5,0);
            \draw (1.75,-1.5) arc(180:360:0.75 and 0.2);
            \draw [dashed](1.75,-1.5) arc(180:0:0.75 and 0.2);
            
            \node [label=above:$P$] at (2.5,0.7) {};
            \draw (2.5,0.855) arc(90:190:0.25 and 2.174);
            \draw [dashed](2.5,0.855) arc(90:0:0.25 and 2.174);
            
            
            \node [label=above:$G_1$] at (1,1.1) {};
            \draw (1.0,0.15) arc(270:90:0.3 and 1.14/2);
            \draw[dashed] (1.0,0.15) arc(270:450:0.3 and 1.14/2);
            
            \node [label=above:$G_2$] at (4,1.1) {};
            \draw (4.0,0.15) arc(270:90:0.3 and 1.14/2);
            \draw[dashed] (4.0,0.15) arc(270:450:0.3 and 1.14/2);
            
            \node [label=center:$\gamma$] at (2.5,-0.1) {};
            \draw[smooth] (5,0) to[out=270,in=-30] (3,-0.5) to[out=150,in=30] (2,-0.5) to[out=210,in=270] (0,0)  to[out=90,in=150] (2,0.5) to[out=-30,in=210] (3,0.5) to[out=30,in=90] (5,0) ;
        \end{tikzpicture}}  
        \caption{}
        \label{fi:noncontractible1}
      \end{subfigure}
      \begin{subfigure}[b]{0.30\textwidth}
        \centering
        \resizebox{\linewidth}{!}{
          \begin{tikzpicture}
          \draw[smooth]  (1.75,-1.5) to[out=120,in=-30] (0,-1) to[out=150,in=-150] (0,1)
          to[out=30,in=150] (2,1) to[out=-30,in=190] (3,0.9) to[out=10,in=200] (4.5,1.3) to[out=210,in=170] (5,0) ;
          
          \draw[smooth] (5,-0.5) to[out=190,in=70] (3.25,-1.5);
          \draw[smooth] (0.4,0.1) .. controls (0.8,-0.25) and (1.2,-0.25) .. (1.6,0.1);
          \draw[smooth] (0.5,0) .. controls (0.8,0.2) and (1.2,0.2) .. (1.5,0);
          
          \draw (1.75,-1.5) arc(180:360:0.75 and 0.2);
          \draw [dashed](1.75,-1.5) arc(180:0:0.75 and 0.2);
          
          \draw (5,0) arc(90:270:0.08 and 0.25);
          \draw (5,0) arc(90:-90:0.08 and 0.25);
          
          \node[circle,fill,inner sep=1pt] at (4.5,1.3) {};
          
          \node [label=above:$P$] at (2.5,0.7) {};
          \draw (2.5,0.855) arc(90:190:0.25 and 2.174);
          \draw [dashed](2.5,0.855) arc(90:0:0.25 and 2.174);
          
          \node [label=above:$G_1$] at (1,1.1) {};
          \draw (1.0,0.15) arc(270:90:0.3 and 1.14/2);
          \draw[dashed] (1.0,0.15) arc(270:450:0.3 and 1.14/2);
          
          \node [label=above:$G_2$] at (3.8,0.9) {};
          \draw (3.8,1.07) arc(90:270:0.25 and 0.955);
          \draw[dashed] (3.8,1.07) arc(90:-90:0.25 and 0.955);
          \node[white] at (5.5,0) {};
          
          \node [label=center:$\gamma$] at (2.5,-0.3) {};
          \draw[smooth] (4.41,0.5) to [out=250, in=0] (1,-0.6) to[out=180,in=270] (0,0)  to[out=90,in=150] (2,0.5) to[out=-30,in=210] (3,0.5) to[out=30,in=200] (3.5,1);
          \draw[dashed][smooth] (3.5,1) [out=350, in=140]to (4.41,0.5);
        \end{tikzpicture}}  
        \caption{}
        \label{fi:noncontractible2}
      \end{subfigure}
      \begin{subfigure}[b]{0.30\textwidth}
        \centering
        \resizebox{\linewidth}{!}{
          \begin{tikzpicture}
          \draw[smooth] (1.75,-1.5) to[out=120,in=10] (0,-1);
          
          \draw[smooth] (0,1) to[out=-10,in=190] (3,0.9) to[out=10,in=200] (4.5,1.3) to[out=210,in=170] (5,0) ;
          
          \draw[smooth] (5,-0.5) to[out=190,in=70] (3.25,-1.5);
          
          \draw (1.75,-1.5) arc(180:360:0.75 and 0.2);
          \draw [dashed](1.75,-1.5) arc(180:0:0.75 and 0.2);
          
          \draw (5,0) arc(90:270:0.08 and 0.25);
          \draw (5,0) arc(90:-90:0.08 and 0.25);
          
          \node[circle,fill,inner sep=1pt] at (4.5,1.3) {};
          
          \draw (0,1) arc(90:270:0.3 and 1);
          \draw [dashed](0,1) arc(90:-90:0.3 and 1);
          \node[circle,fill,inner sep=1pt] at (-0.3,0) {};
          
          \node [label=above:$P$] at (2.5,0.7) {};
          \draw (2.5,0.83) arc(90:190:0.25 and 2.15);
          \draw [dashed](2.5,0.83) arc(90:0:0.25 and 2.15);
          
          \node [label=above:$G_1$] at (1,0.7) {};
          \draw (1.0,0.84) arc(90:270:0.3 and 0.905);
          \draw [dashed](1.0,0.84) arc(90:-90:0.3 and 0.905);
          
          \node [label=above:$G_2$] at (3.8,0.9) {};
          \draw (3.8,1.07) arc(90:270:0.25 and 0.955);
          \draw[dashed] (3.8,1.07) arc(90:-90:0.25 and 0.955);
          
          
          \node [label=center:$\gamma$] at (2.5,-0.3) {};
          \draw[smooth] (4.41,0.5) to [out=250, in=0] (-0.26,-0.5);
          \draw[smooth] (-0.26,0.5) to[out=0,in=210] (3,0.7) to[out=30,in=200] (3.5,1);
          \draw[dashed][smooth] (3.5,1) [out=350, in=140]to (4.41,0.5);
          
          \node[white] at (5.5,1) {};

        \end{tikzpicture}}  
        \caption{}
        \label{fi:noncontractible3}
      \end{subfigure}
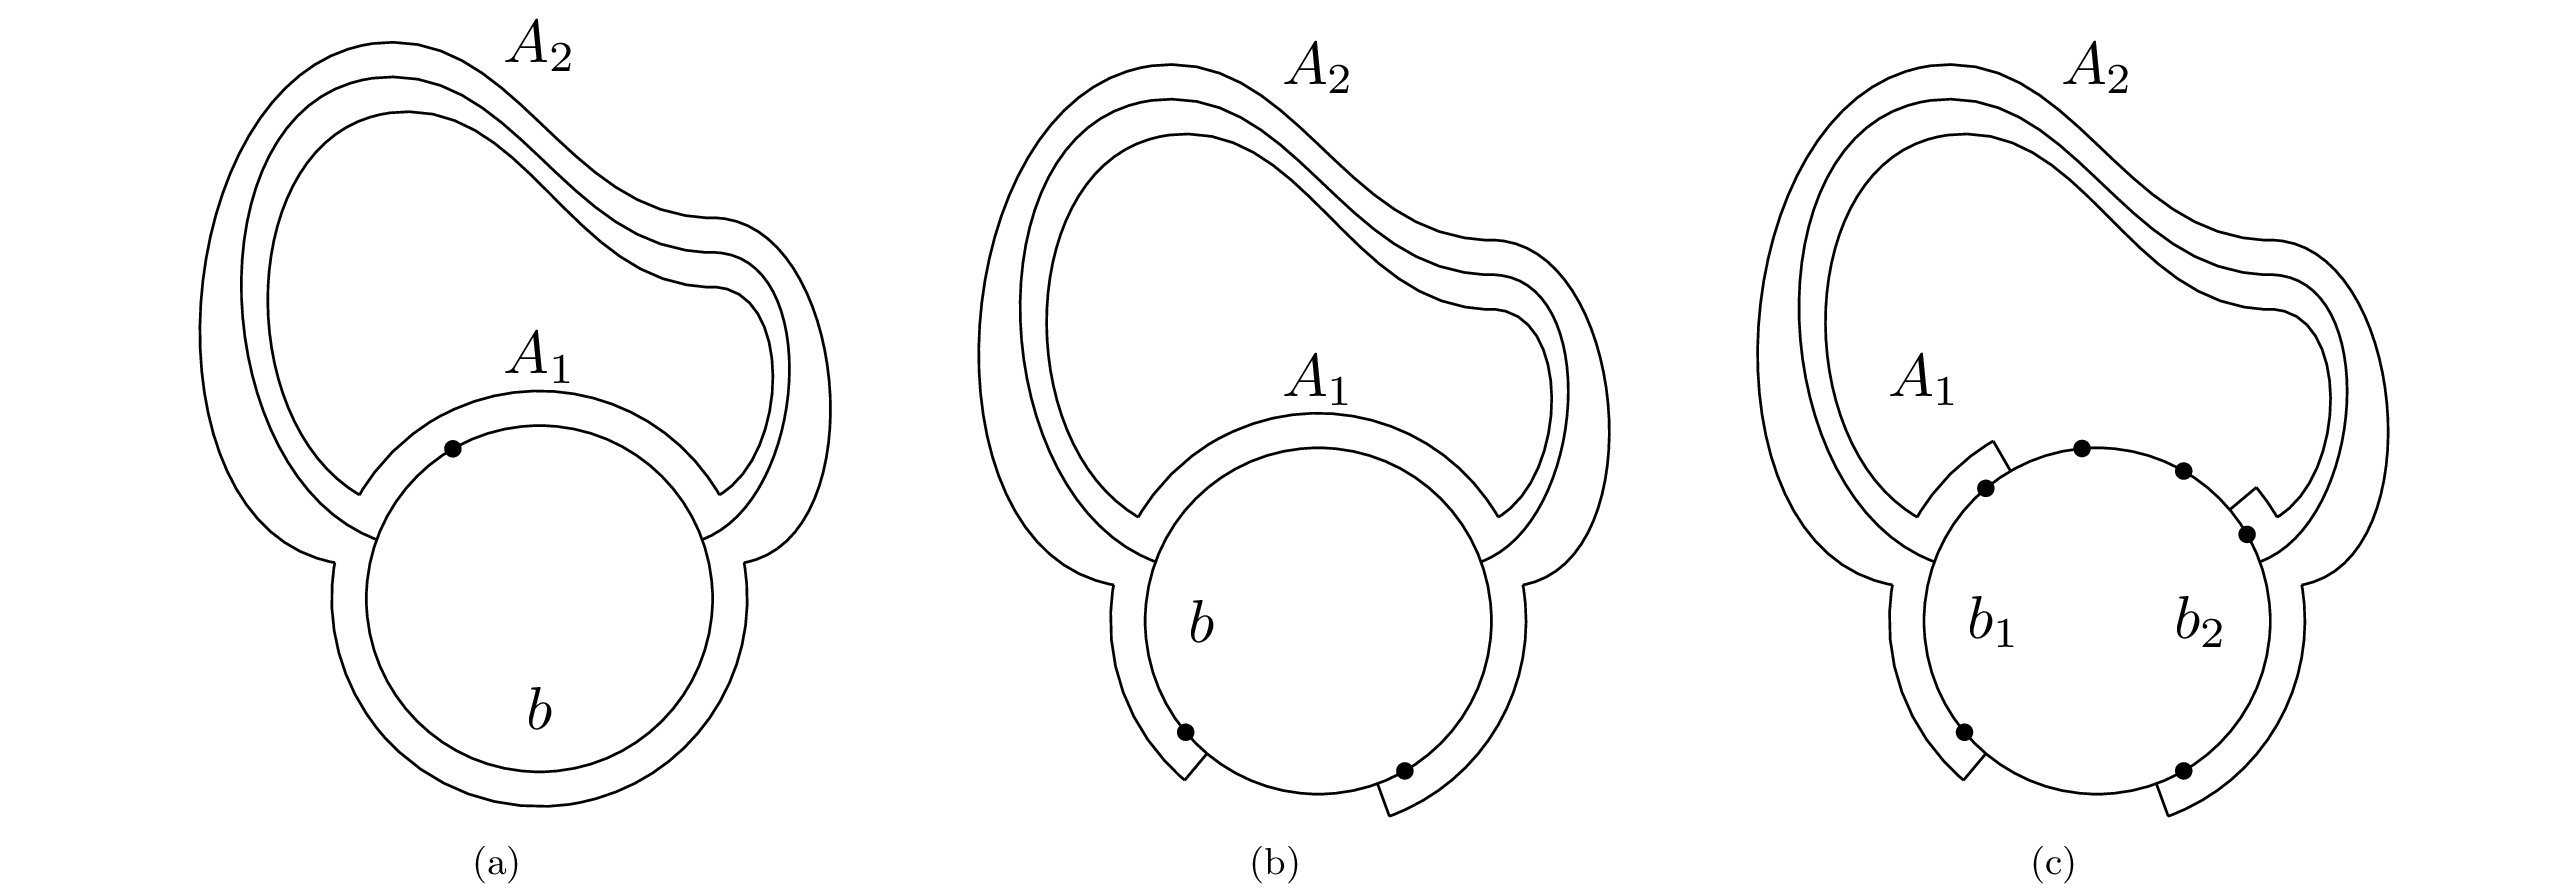
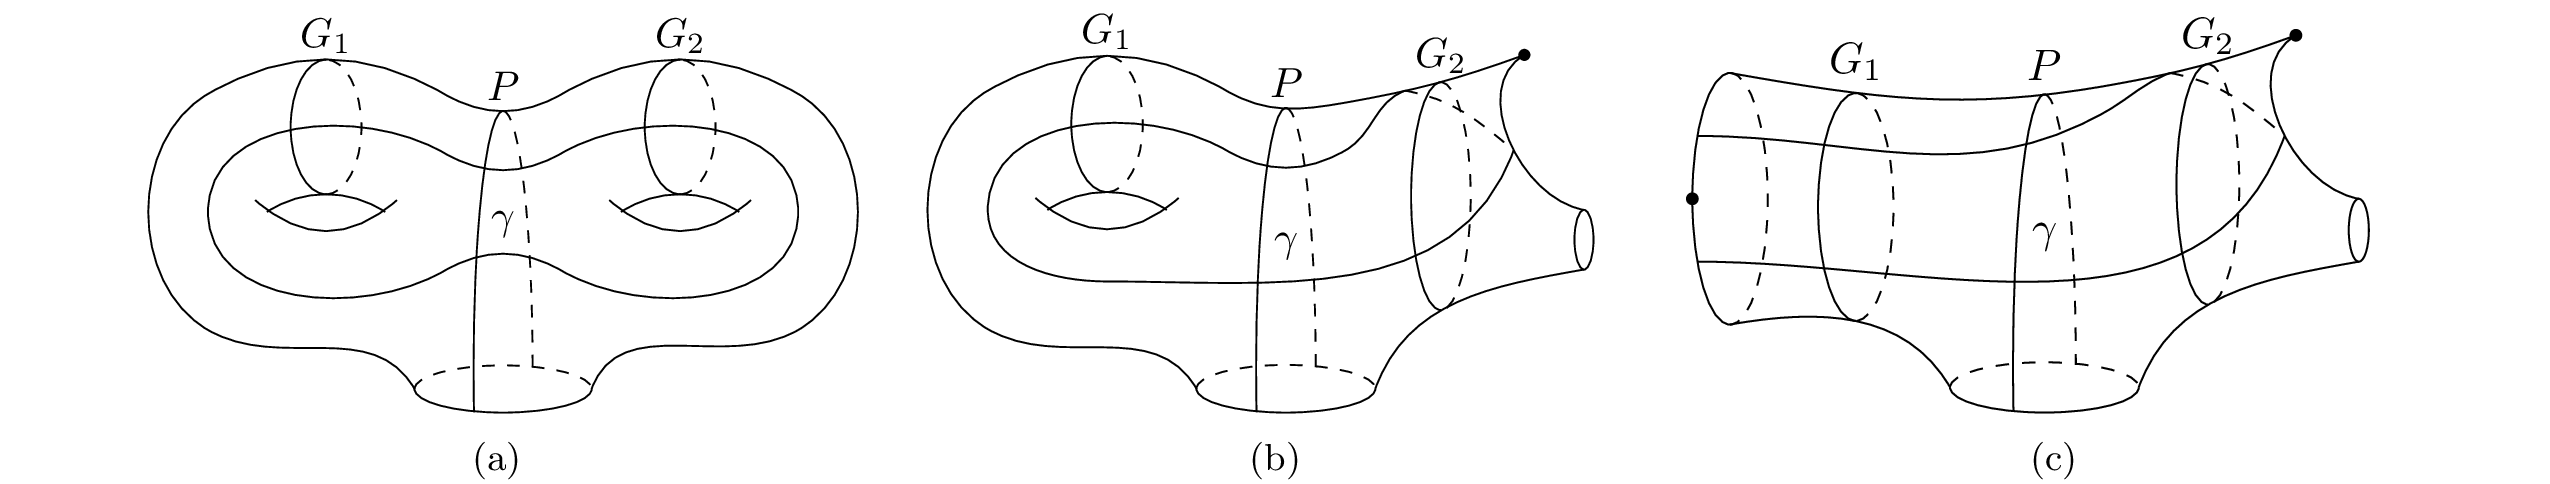
    \caption{Curves chosen in the proof of Proposition \ref{pr:continuoussection3}}
    \end{figure}